What You Get
A complete breakdown of everything inside Terminal Paul.
Dashboard & Market Overview
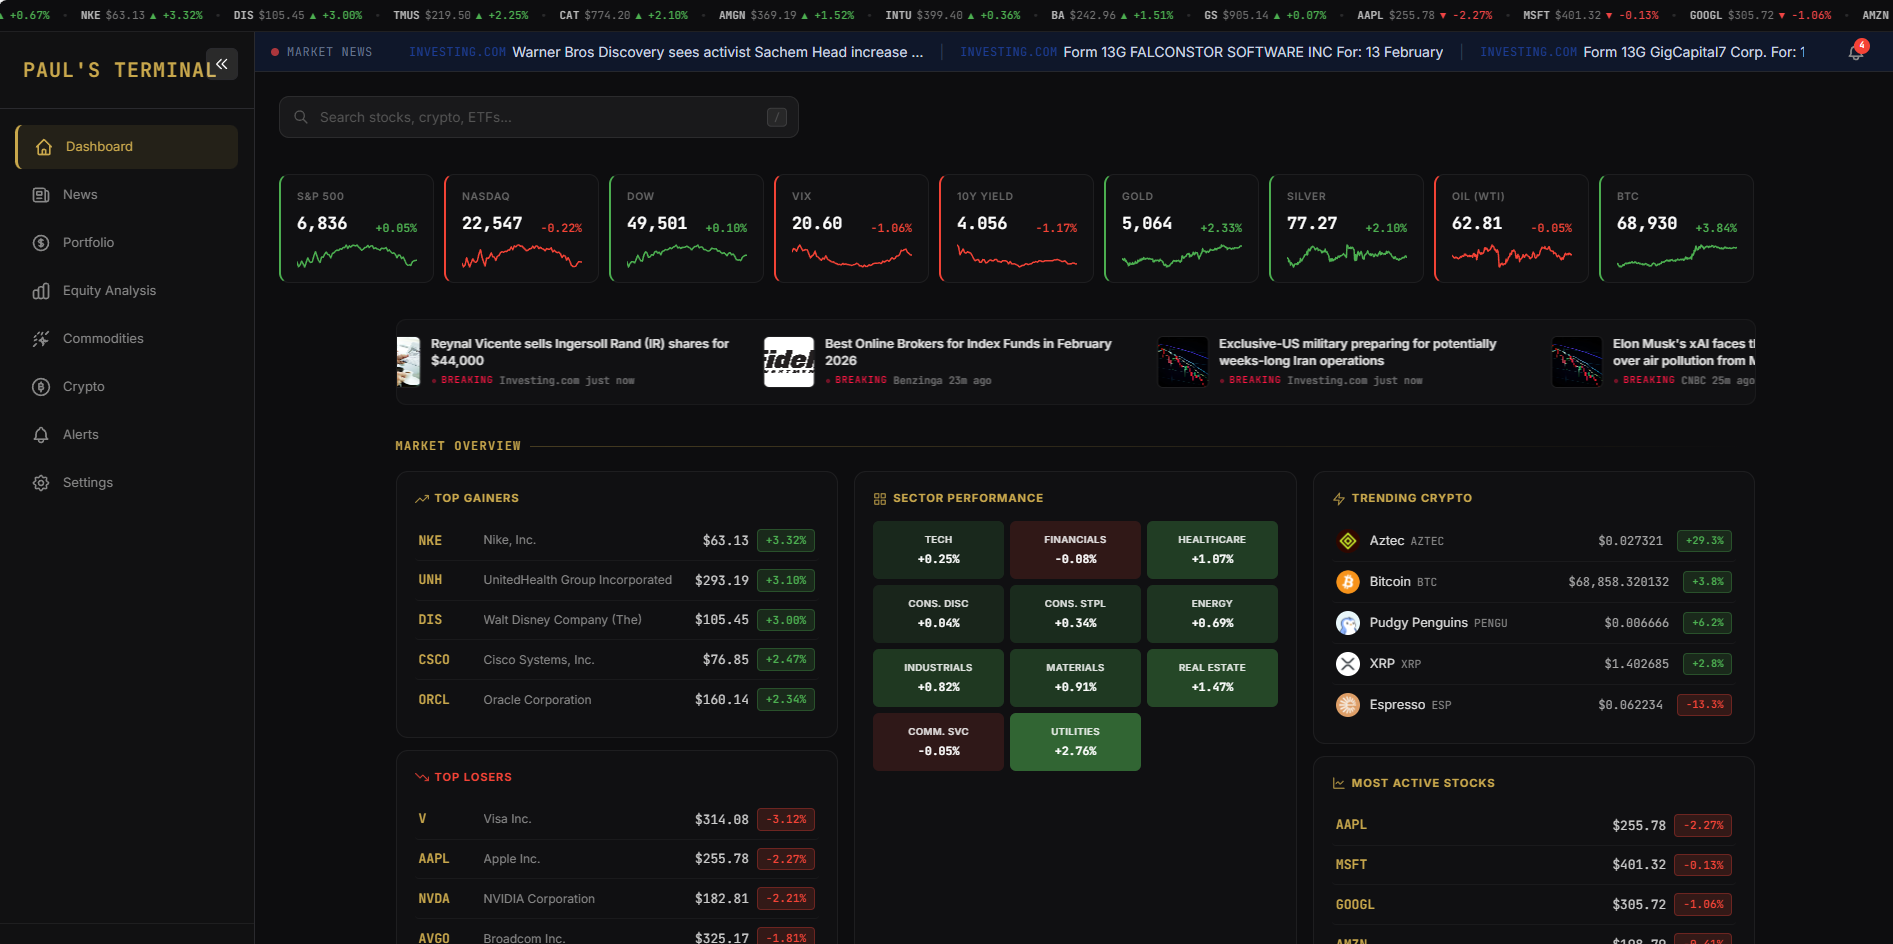
Live Ticker Tape
Real-time scrolling prices for ~40 major stocks, auto-refreshing every 60 seconds. Pauses on hover.
Market Pulse Strip
At-a-glance view of S&P 500, Nasdaq, Dow, VIX, 10Y Yield, Gold, Silver, Oil, and Bitcoin with sparkline charts.
Market Movers
Top gainers, top losers, and most active stocks updated in real time.
Sector Performance
Color-coded performance grid for all 11 S&P sector ETFs (XLK, XLF, XLV, XLY, XLP, XLE, XLI, XLB, XLRE, XLC, XLU).
Macro Indicators
Treasury yield curve (3M, 5Y, 10Y, 30Y), yield spread, and recession signal detection via inverted 10Y-3M.
Market Sentiment
VIX-based sentiment reading with volatility level classification (Low, Moderate, High, Extreme) and contextual market summary.
Trending Crypto
Top 10 trending cryptocurrencies displayed on the dashboard with price, 24h change, and market cap rank.
Asset Class Tabs
Quick-view tabs for Equities, Crypto, and Commodities with summary grids and sparklines on the dashboard home.
News
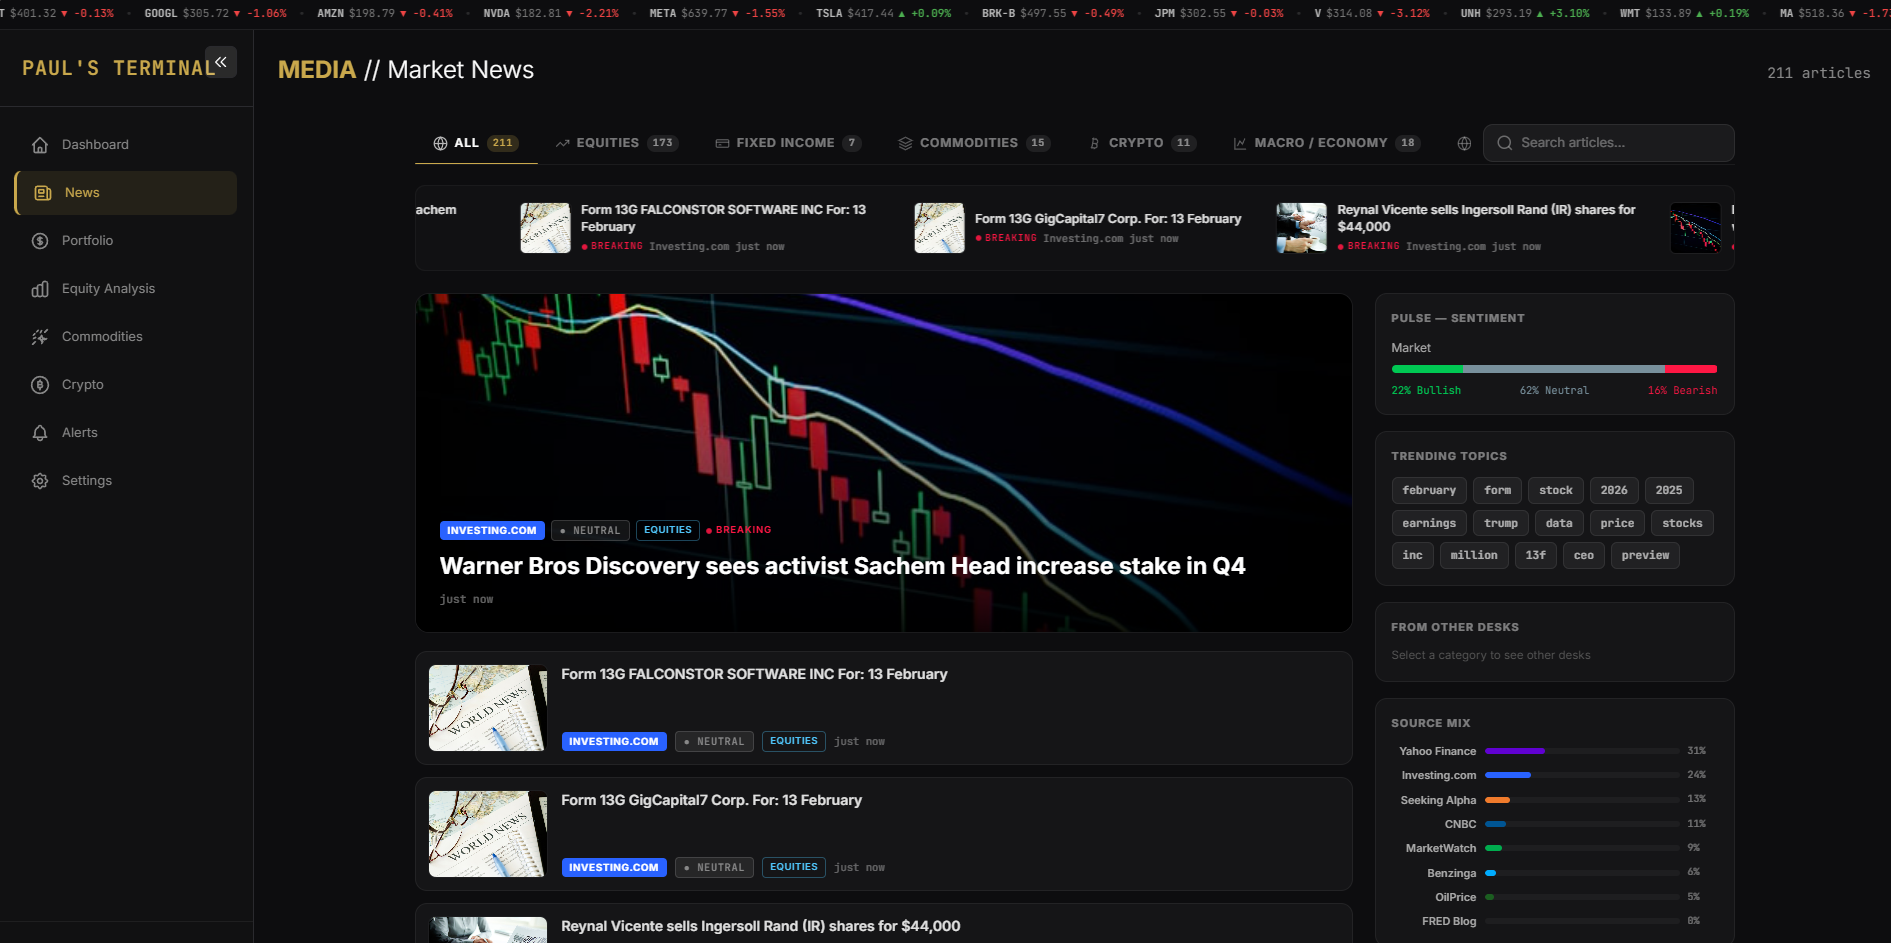
14 News Sources
Aggregated from CNBC, MarketWatch, Investing.com, Yahoo Finance, Reuters, Financial Times, WSJ, Barron's, Seeking Alpha, Benzinga, CoinDesk, OilPrice, Politico, and FRED Blog.
Category Filtering
Filter by Equities, Fixed Income, Commodities, Crypto, Macro, and Geopolitics. Category tabs show article counts.
Sentiment Analysis
Keyword-based Bullish/Neutral/Bearish scoring on every headline, with a Sentiment Pulse widget showing the overall breakdown.
Breaking News Strip
Auto-scrolling horizontal strip highlighting articles published within the last 30 minutes.
Trending Topics
Extracted keywords and ticker mentions from headlines. Click any tag to filter the feed.
Ticker Mentions
Auto-detected stock tickers in headlines with hover popovers showing live price and change.
Source Mix Widget
Visual bar-chart breakdown of source distribution across the current feed.
Stock Screener
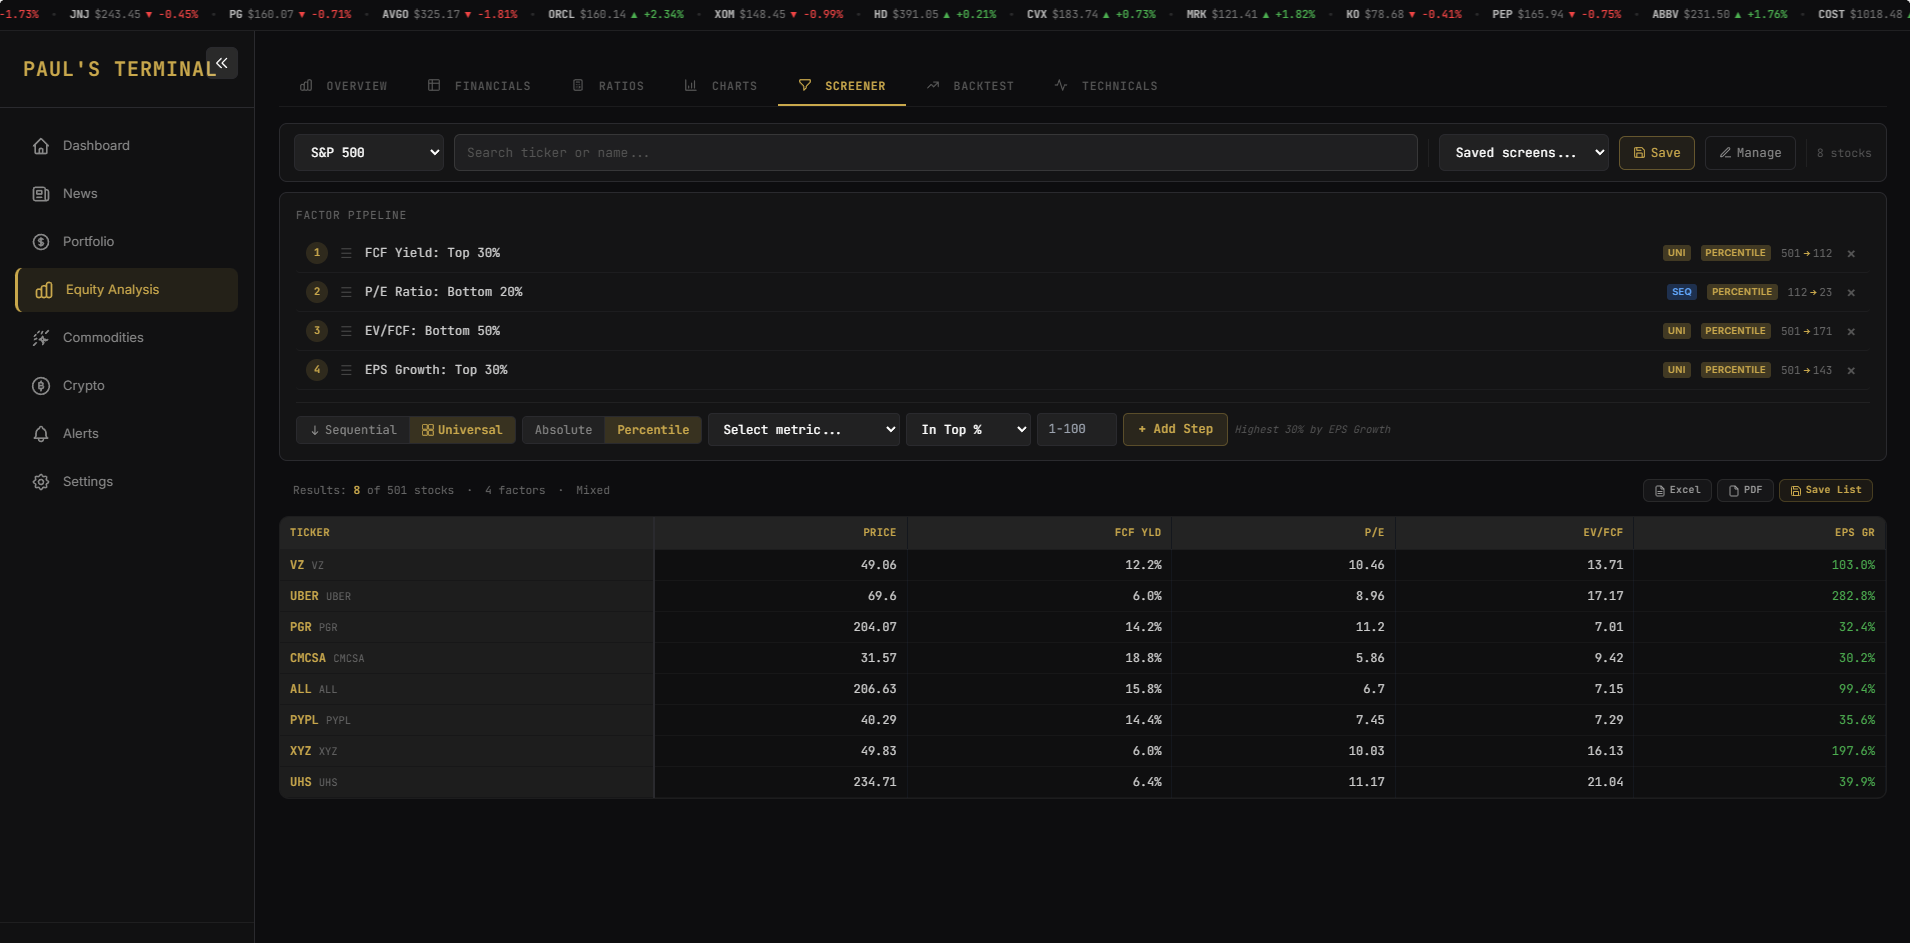
Multi-Universe Screening
Screen across S&P 500, NASDAQ 100, Dow Jones, Russell 2000, and Russell 3000.
20+ Screening Filters
Filter by P/E, Forward P/E, PEG, EV/EBITDA, P/S, P/B, FCF Yield, Dividend Yield, Gross/Operating/Net Margin, ROE, ROA, Revenue Growth, EPS Growth, Market Cap, Current Ratio, Debt/Equity, Net Debt, Analyst Upside, and Price.
Absolute & Percentile Modes
Filter by exact values or by relative ranking (top/bottom percentile within the universe).
Saved Screening Models
Save, load, and manage your custom screening configurations.
Factor Pipeline Builder
Build multi-step screening pipelines in Sequential or Universal mode. Each step shows input/output counts.
Sortable Results
Click any column header to sort. Results show ticker, price, change, market cap, and all 20+ screening metrics.
Equity Analysis
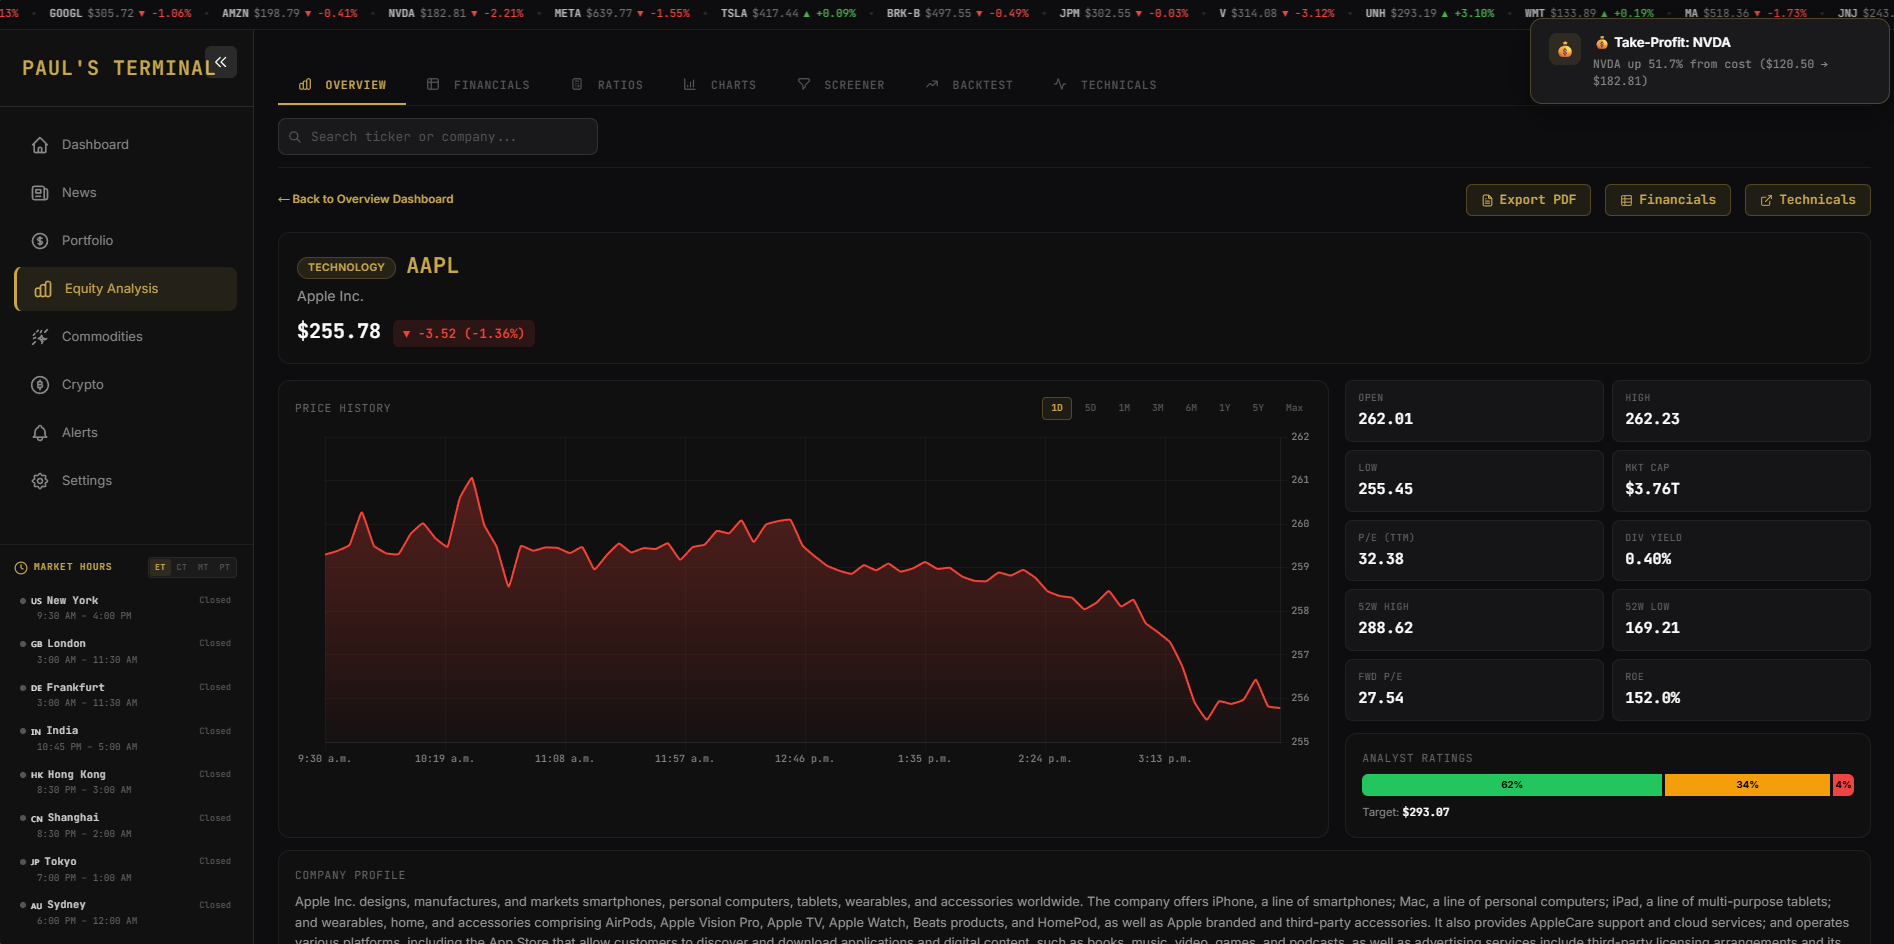
Company Overview
Full company profile with key statistics (Open, High, Low, 52W range, P/E, Div Yield, ROE), analyst ratings bar (Buy/Hold/Sell breakdown with mean target price), and expandable business description.
Interactive Price Charts
Candlestick and line charts across 9 timeframes: 1-minute, 5-minute, 15-minute, 30-minute, 1-hour, 4-hour, daily, weekly, and monthly.
Financial Statements
Income statement, balance sheet, and cash flow from SEC EDGAR filings. Annual or quarterly view.
70+ Financial Ratios
Organized into 10 categories: Profitability, Valuation, Liquidity, Solvency, Efficiency, Cash Flow, Per Share, DuPont Analysis, Growth, and OpEx Structure. Annual and quarterly views.
Ratio Charts
Line charts for 70+ metrics across 10 categories, plotted over time from SEC filing data.
Key Metrics Table
Annual and quarterly key financial metrics (Revenue, Net Income, EPS, FCF, and more) with trend sparklines, sourced from SEC EDGAR filings.
Analyst Data
Price targets (mean, high, low), recommendation scores, consensus ratings, and number of analyst opinions.
PDF Export
Generate a tear sheet for any stock with key stats, analyst ratings, price chart, and company profile.
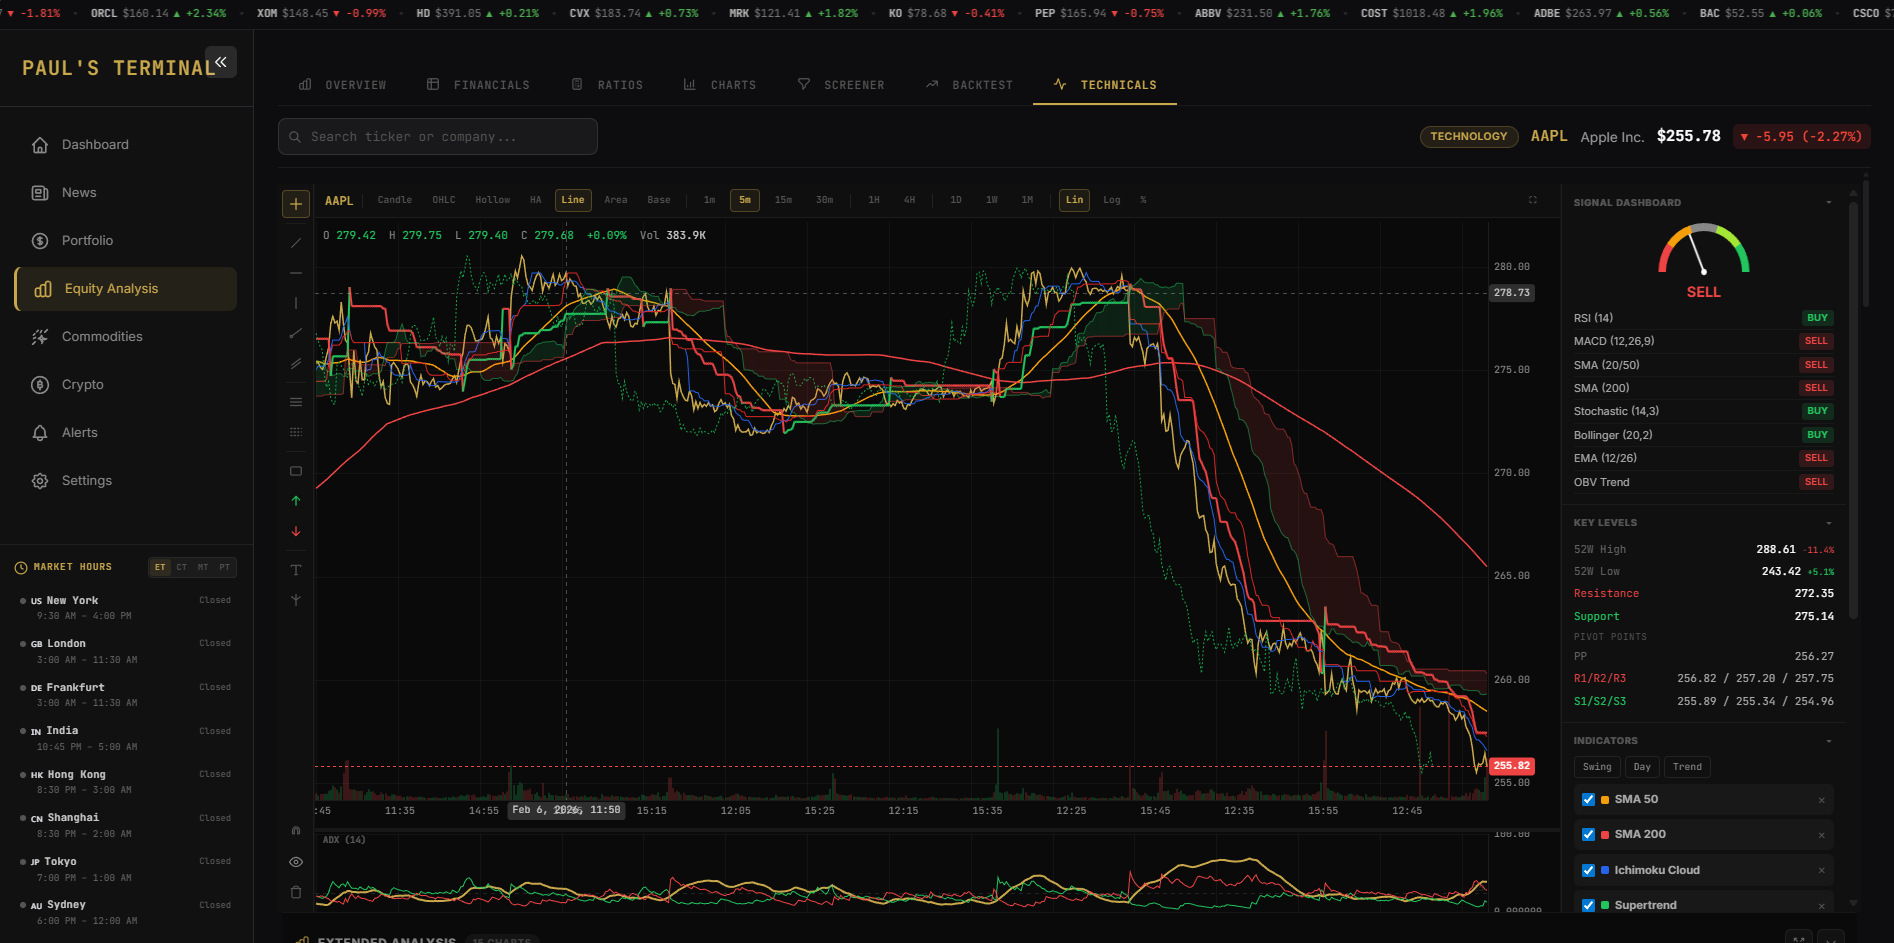
Technical Analysis
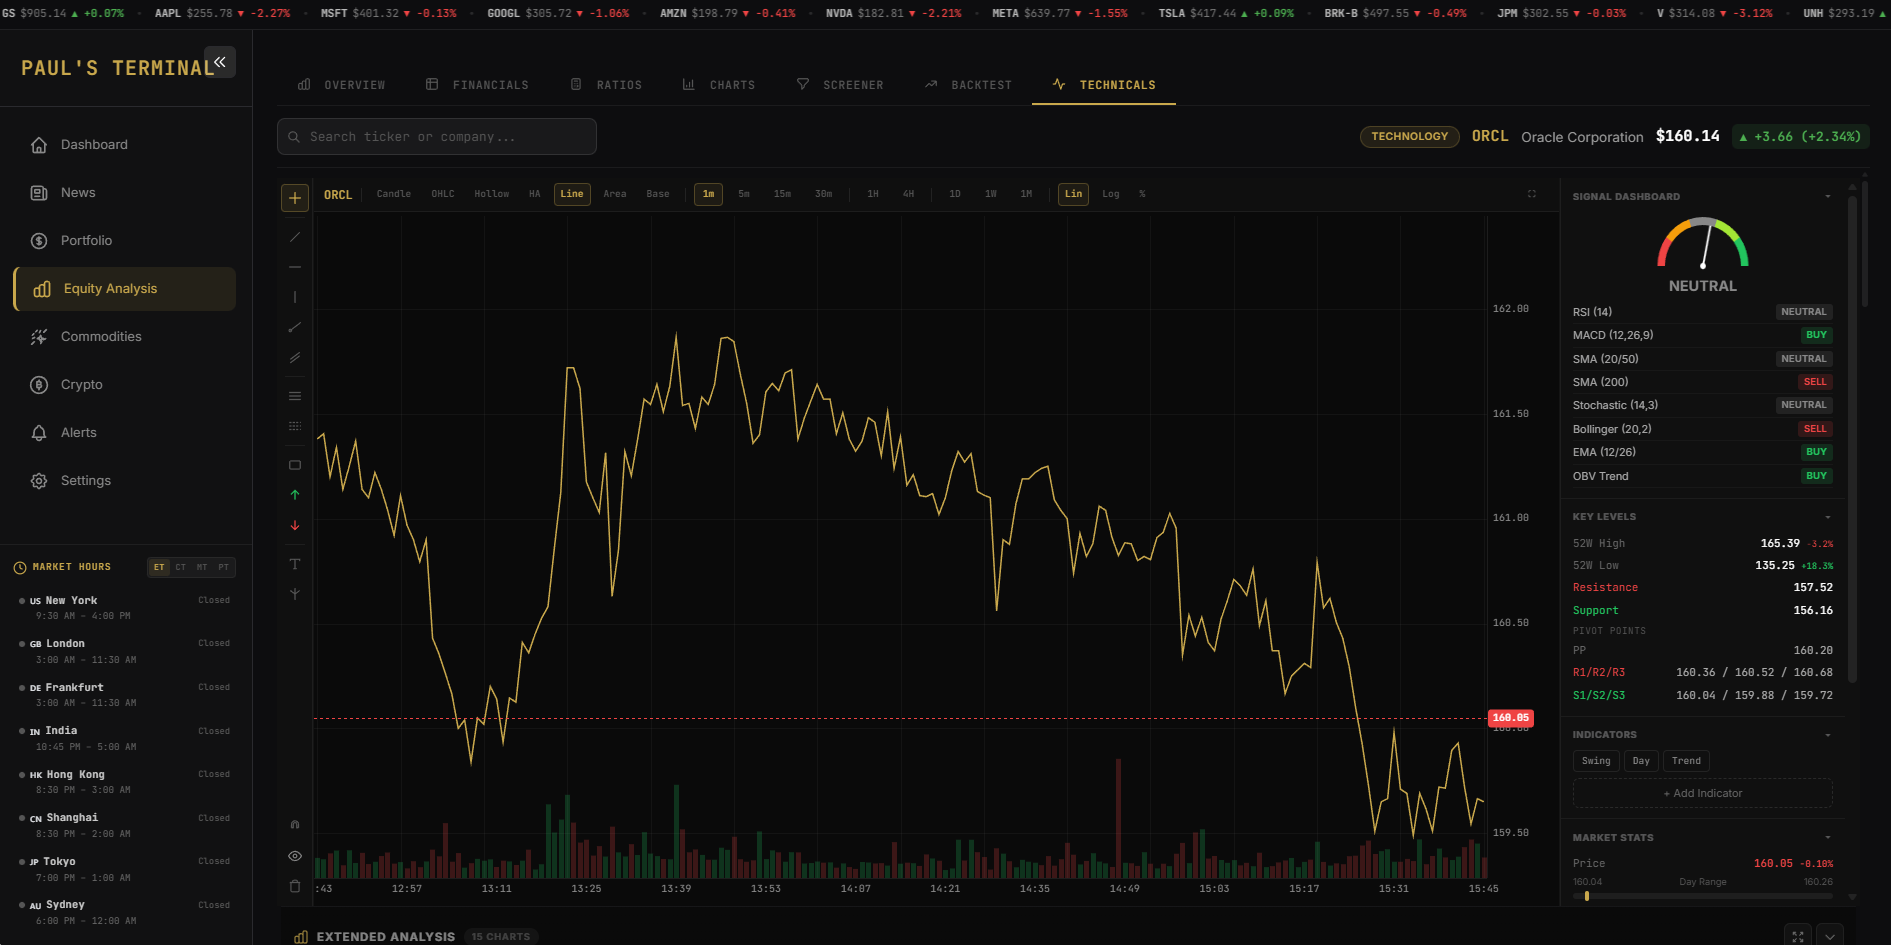
19 Overlay Indicators
SMA, EMA, WMA, DEMA, TEMA, Hull MA, Bollinger Bands, Keltner Channel, Donchian Channel, Price Envelopes, Linear Regression Channel, VWAP, Parabolic SAR, Supertrend, and Ichimoku Cloud.
17 Oscillator Indicators
RSI, MACD, Stochastic, ATR, Williams %R, CCI, ROC, ADX (+DI/-DI), Aroon, OBV, Accumulation/Distribution, MFI, CMF, Awesome Oscillator, Force Index, and TRIX. Each in its own sub-pane.
Volume Analysis
Volume bars color-coded by candle direction, Volume SMA, On-Balance Volume (OBV), and a full Volume Profile histogram showing price-by-volume distribution with Point of Control.
Support & Resistance
Auto-detected swing highs/lows, clustered price levels with strength ratings, and classic pivot points (PP, R1-R3, S1-S3).
Signal Scanner
Multi-indicator signal engine combining RSI, MACD, SMA, Stochastic, Bollinger Bands, EMA, and OBV into a composite rating from STRONG BUY to STRONG SELL. Scannable across a watchlist.
Candlestick Pattern Detection
20+ auto-detected patterns: Doji, Hammer, Engulfing, Morning/Evening Star, Three White Soldiers, Three Black Crows, Harami, Piercing Line, Dark Cloud Cover, Marubozu, and more. Annotated directly on the chart.
Drawing Tools
15 tools: Trend Line, Horizontal/Vertical Line, Ray, Extended Line, Parallel Channel, Fibonacci Retracement & Extension, Rectangle, Ellipse, Long/Short Position, Price/Date Range, Text/Price Label, and Pitchfork. Magnet mode and per-ticker persistence.
Chart Types & Scales
7 chart types: Candlestick, OHLC Bars, Hollow Candles, Line, Area, Baseline, and Heikin Ashi. Linear, logarithmic, and percent scale modes.
Sector Heatmap
Visual performance grid of sector ETFs with color intensity based on change magnitude.
Key Levels Table
Support and resistance levels with strength labels and distance from current price.
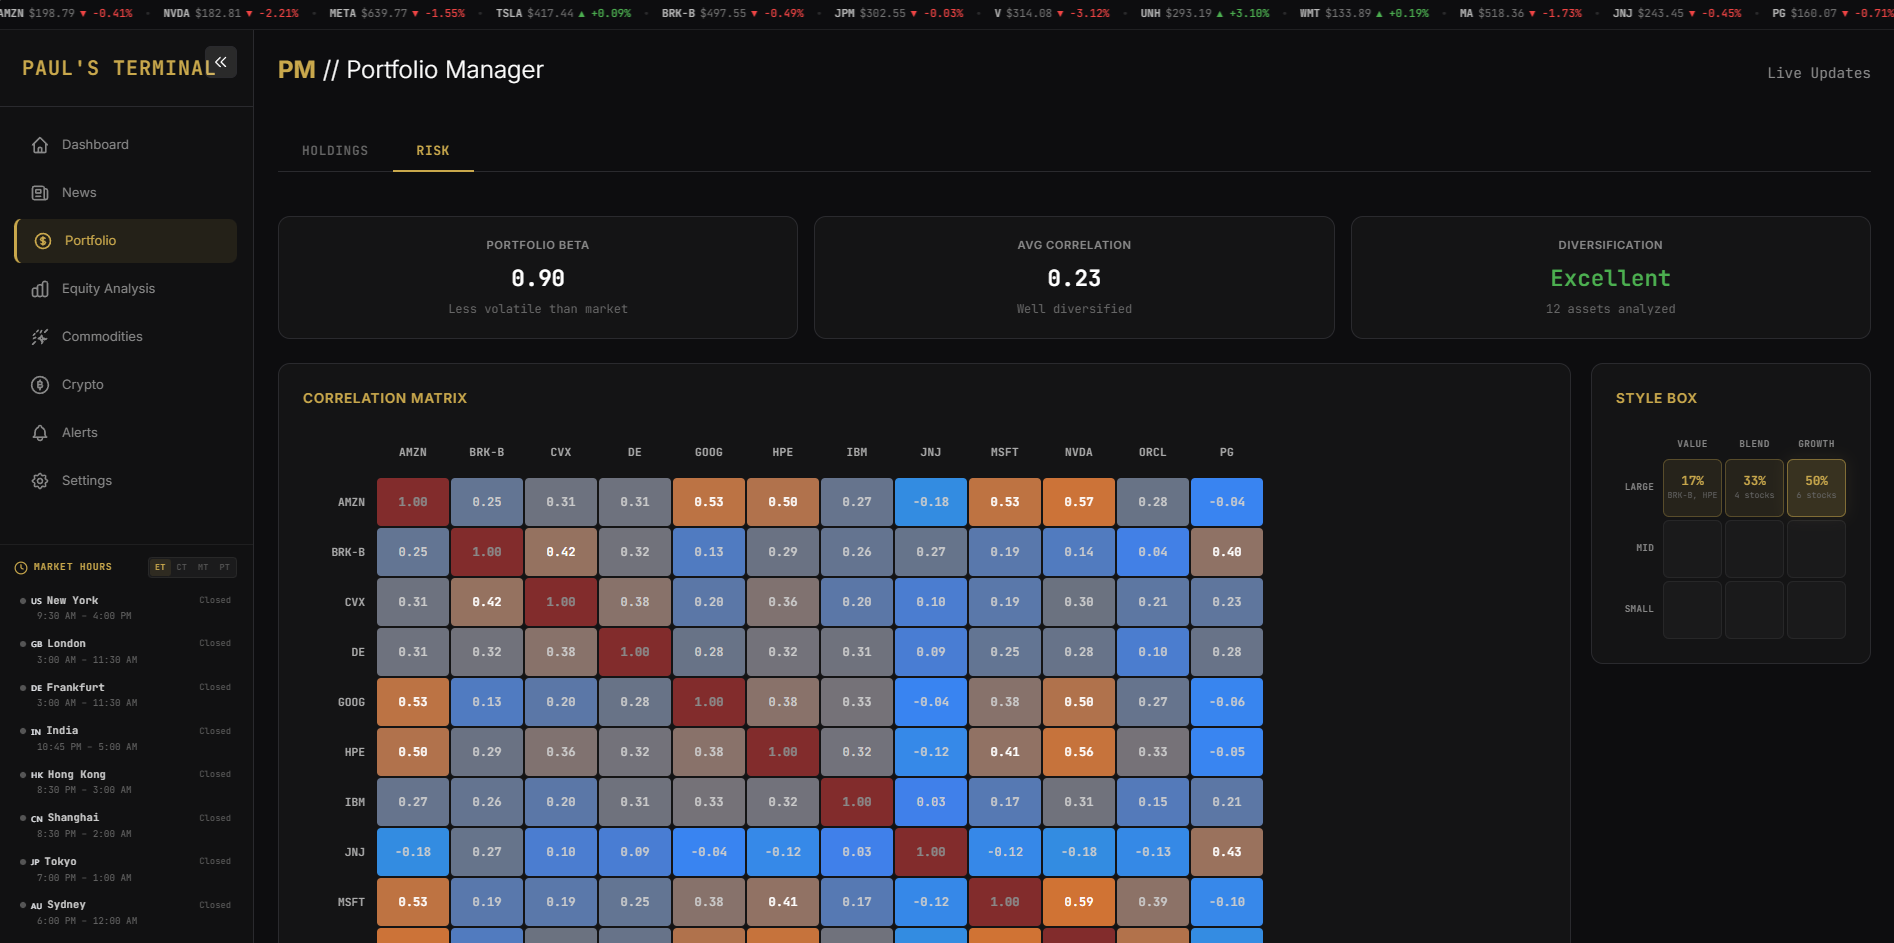
Portfolio Management
Holdings Dashboard
Total equity, day change, unrealized P&L vs. cost basis, and realized P&L from closed positions.
Allocation Chart
Donut chart showing portfolio allocation by ticker with total value in the center.
Trade Entry
Buy/sell panel with ticker search, shares, price, date picker, and total calculation.
Transaction History
Full log of all trades with date, type, ticker, quantity, price, and total.
Risk Analytics
Diversification score, average correlation, per-asset Beta vs. SPY, Volatility, Annualized Return, Return/Risk ratio, and Style Box classification (3x3 grid: Large/Mid/Small vs. Value/Blend/Growth).
Correlation Heatmap
Pairwise correlation matrix across all holdings with color-coded cells and hover tooltips showing correlation strength labels.
Strategy Backtesting
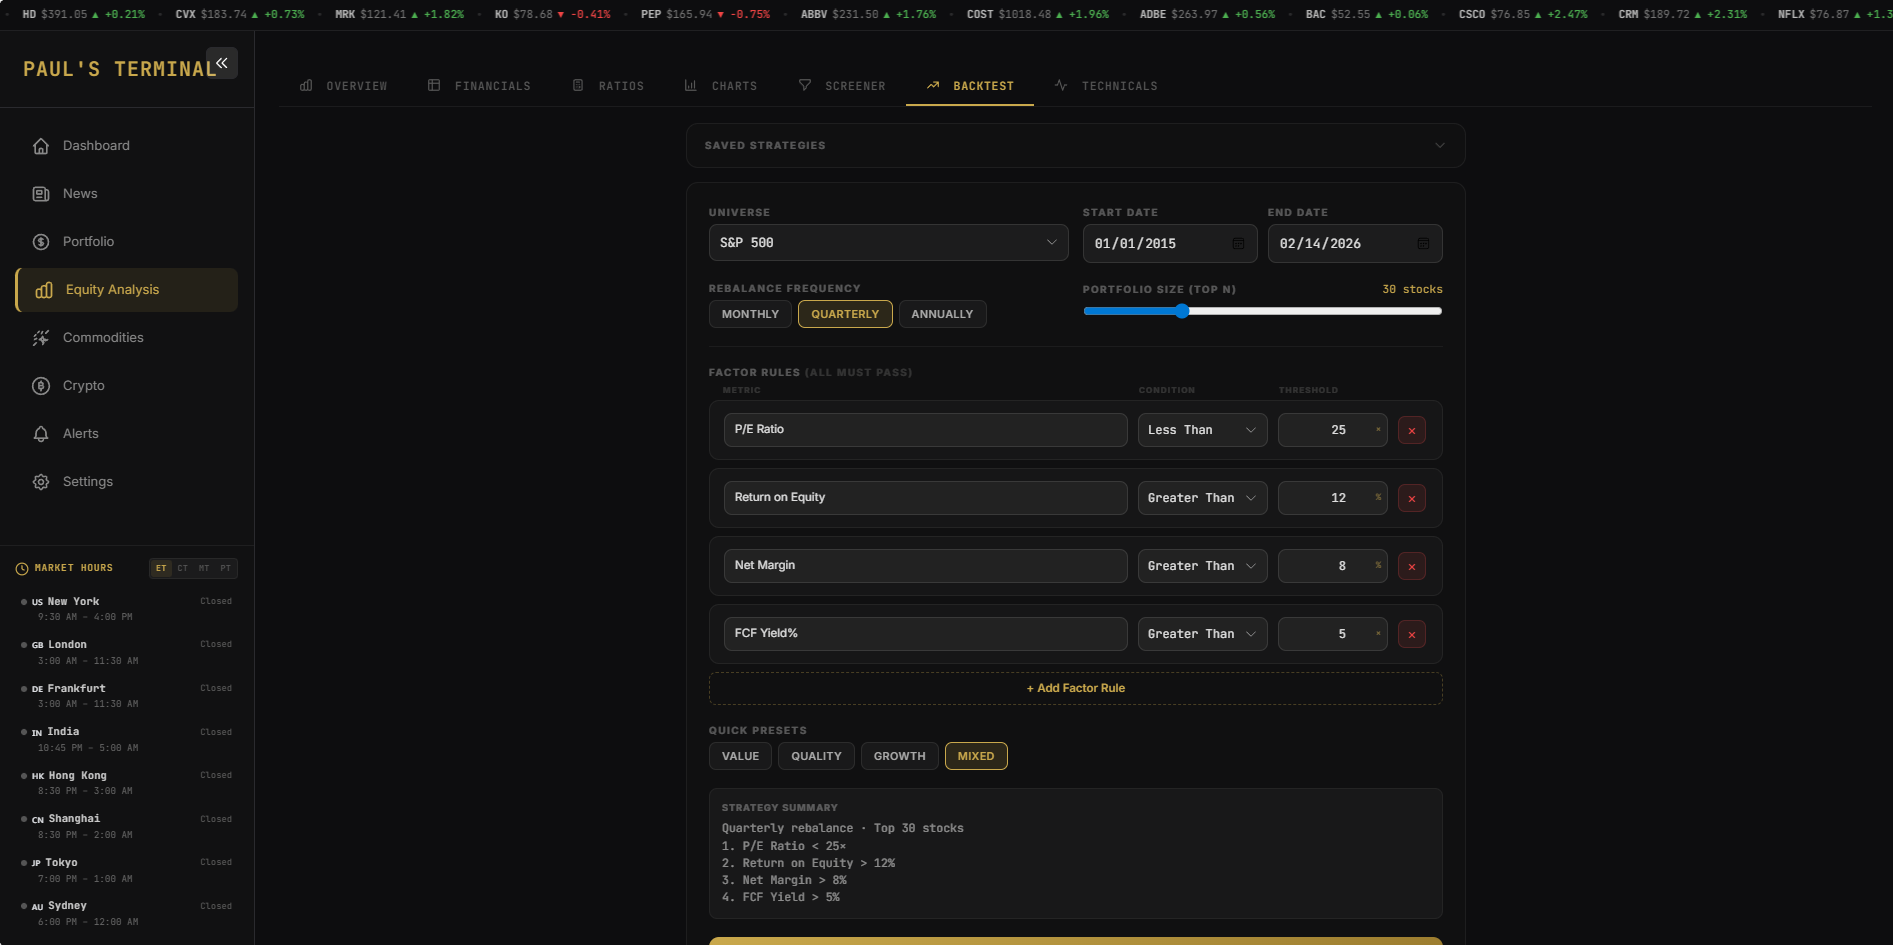
Factor-Based Backtester
Test strategies built from fundamental factor rules against S&P 500, NASDAQ-100, Russell 2000, or Russell 3000 universes.
75+ Screening Factors
Across 10 categories: Profitability, Valuation, Liquidity, Solvency, Efficiency, Cash Flow, Per Share, DuPont Analysis, Growth, and OpEx Structure. Searchable metric picker.
Quick Presets
One-click strategies: Value, Quality, Growth, and Mixed.
Configurable Parameters
Custom date range, rebalance frequency (Monthly, Quarterly, Annually), and portfolio size (5-100 stocks).
16+ Performance Metrics
CAGR, Total Return, Alpha, Sharpe, Sortino, Calmar, Max Drawdown, Volatility, Beta, Information Ratio, Tracking Error, VaR (95%), CVaR (95%), Win Rate, and Best/Worst Day. All shown alongside SPY benchmark.
Strategy Scorecard
Composite letter grade (A+ to F) based on Sharpe, Alpha, Drawdown, Win Rate, and Information Ratio, with a summary of key performance highlights.
Visual Analytics
Equity curve vs. benchmark, annual returns bar chart, drawdown (underwater) chart, monthly returns heatmap, rolling returns (12M/36M), and top-5 drawdown episodes table.
Saved Strategies
Save, load, and manage backtesting configurations with cached results for instant replay.
Rebalance History
Full table of every rebalance date, stocks selected, portfolio turnover, and top holdings.
Alerts & Notifications
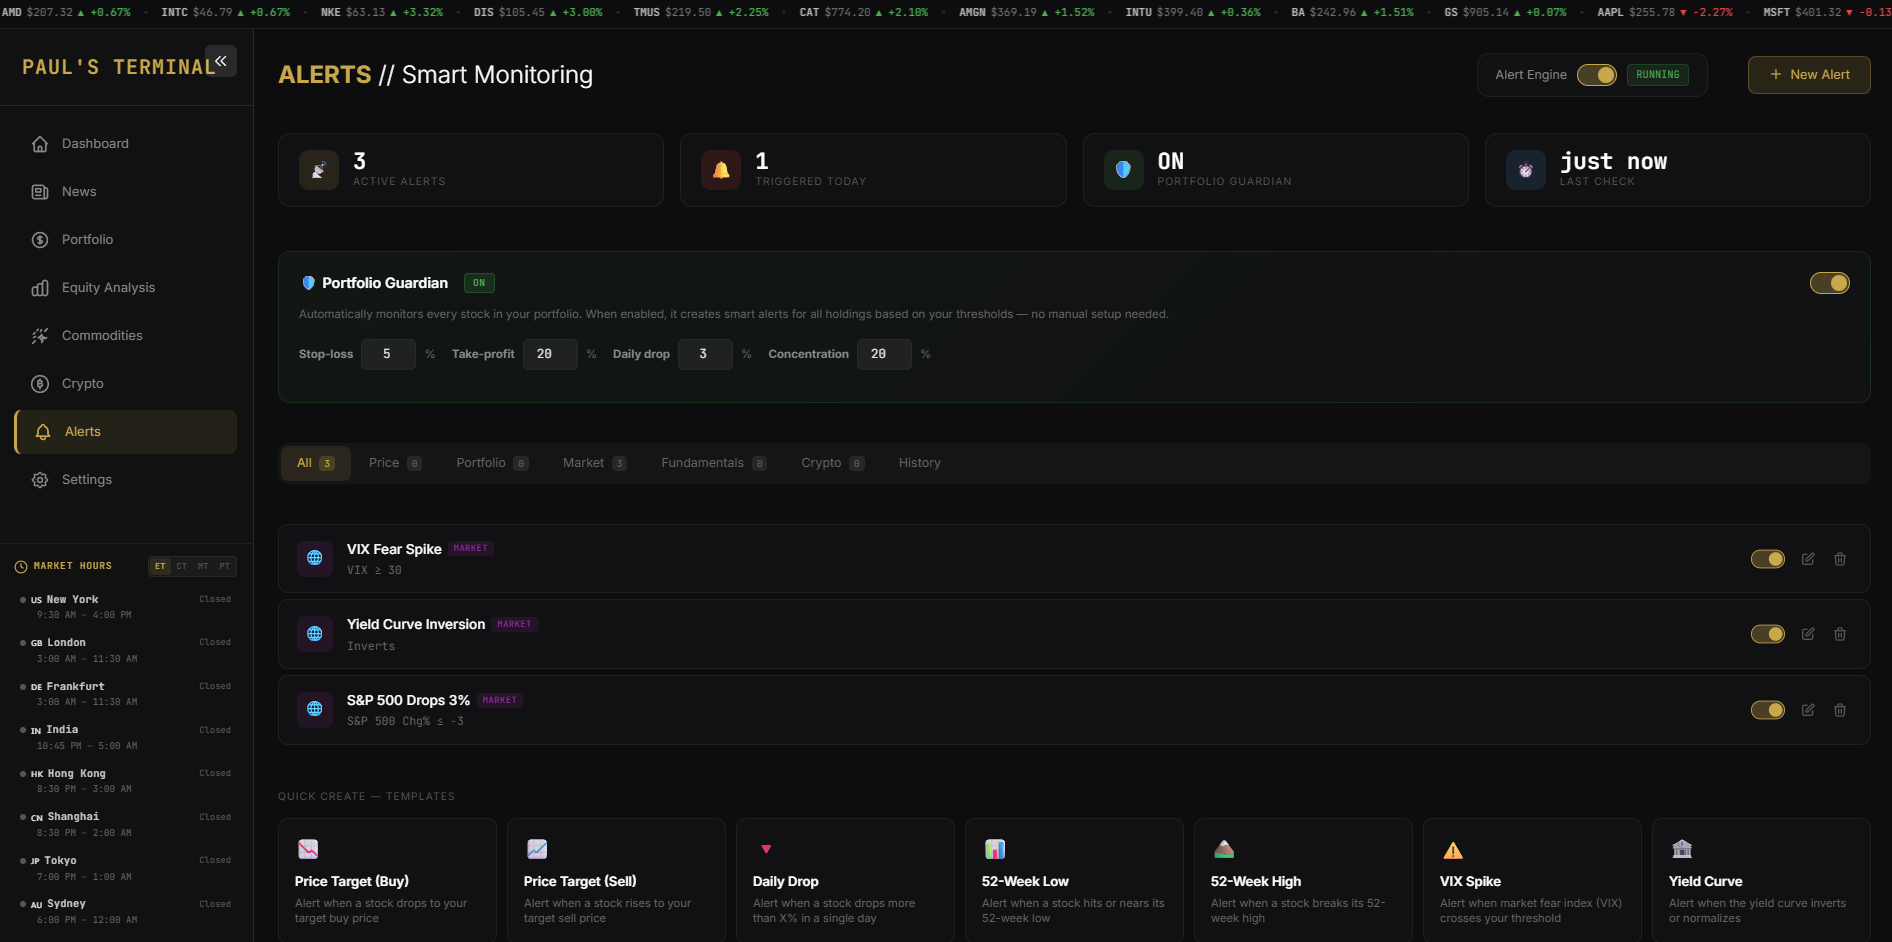
Custom Alerts
Create alerts on price targets, daily change, 52-week highs/lows, trailing stops, P/E ratio, dividend yield, VIX level, S&P 500 change, yield curve inversion, and crypto prices. Configurable cooldowns and one-shot mode.
Portfolio Guardian
Automatic monitoring of all portfolio holdings with configurable stop-loss, take-profit, daily drop, and concentration thresholds. Preset profiles: Conservative, Growth, Value, and Active Trader.
Quick Templates
12 one-click alert templates: Price Target (Buy/Sell), Daily Drop, 52-Week Low/High, VIX Spike, Yield Curve, P/E Value Zone, Dividend Yield, Market Correction, Crypto Price, and Trailing Stop.
Notification System
Bell icon with unread badge, notification dropdown with read/unread tracking, and slide-in toast alerts when conditions trigger.
Alert History
Log of all triggered alerts with timestamps, trigger counts, and category filtering (Price, Portfolio, Market, Fundamentals, Crypto).
Crypto
Global Crypto Stats
Total market cap, 24h volume, BTC dominance, ETH dominance, active cryptocurrencies, and total markets.
Trending Coins
Currently trending cryptocurrencies with price, 24h change, and market cap rank.
Full Market Table
Sortable by rank, price, 1h/24h/7d change, market cap, volume, with 7-day sparkline charts and pagination.
Coin Detail View
Price chart with ranges (1D, 7D, 1M, 3M, 1Y, 5Y, Max), key stats (market cap, supply, ATH), project description, and external links.
Crypto Search
Search by coin name or symbol with instant results.
Commodities
Sector Boards
Energy, Metals, and Agriculture sectors with price, dollar change, percent change, and 5-day trend sparkline for each commodity.
Spotlight Chart
Click any commodity to see a price chart with range selector (1D, 5D, 1M, 3M, 6M, 1Y, 5Y, Max), day range, and 52-week range.
Key Ratios
Gold/Silver ratio and Oil/Gas ratio, clickable to chart.
Macro Context Bar
DXY (US Dollar Index) and 10-Year Treasury Yield shown at top of commodities view for macro context.
Search & Navigation
Global Search
Search stocks, crypto, and ETFs from anywhere with the / keyboard shortcut.
Command Palette
Quick-access shortcuts to any page or action: portfolio, screener, news, financials, backtesting, technicals, charts, risk, heatmap, and more.
Collapsible Sidebar
Minimize the sidebar for more screen space. Toggle with Ctrl+B.
Hash-Based Routing
Deep-link directly to any stock's overview, technicals, financials, or ratios (e.g., #equity/AAPL/overview).